










PRODUCTS

FMCS management platform

PRODUCTS

FMCS management platform

BACKGROUND REQUIREMENTS

Core requirements for intelligent factory operations and maintenance systems

Real-Time Monitoring for MEP / HVAC / Process / Office Environment Systems
Instantly collect facility operational data with real-time monitoring and alarm capabilities, supporting trend analysis of critical operating parameters. The platform also enables scheduling and scenario-based control for small-scale air handling units.
Management & Analytics Application Tools
Offering a comprehensive suite of tools including visualization models, report generation, data analytics dashboards, alarm systems, equipment management, and operations & maintenance management. Through real-time monitoring and intelligent analytics, we optimize equipment operation and maintenance schedules, enhance decision support and energy efficiency management, and ensure systems operate at peak performance while maintaining regulatory compliance.
System Integration
Unify all subsystems within the facility, eliminate data silos, and achieve centralized management of equipment, energy, and environmental data. Through coordinated applications and optimized control strategies, we enable synergistic operation and intelligent maintenance across all systems, improving overall efficiency and scalability.
Certification System Tools
ISO 50001: Establishes a systematic energy management framework for organizations, covering energy planning, energy baseline setting, performance indicators, monitoring and measurement, operational control, and continuous improvement.
ISO 14064: Provides tools for the quantification, monitoring, reporting, and verification of greenhouse gas emissions and emission reductions.

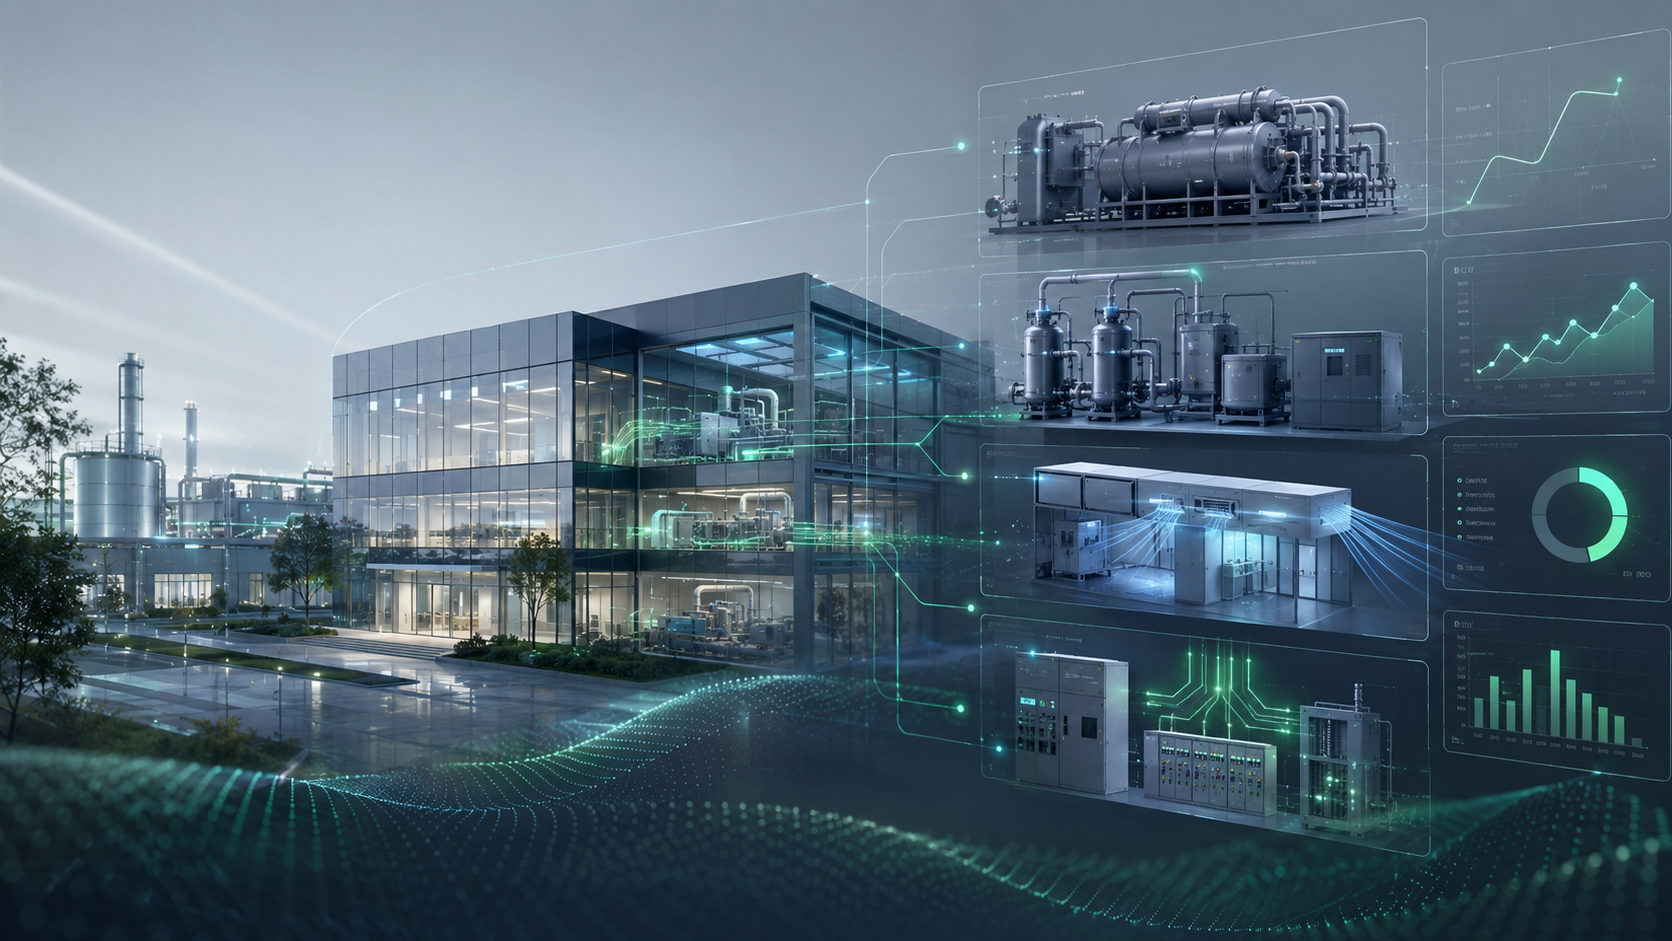
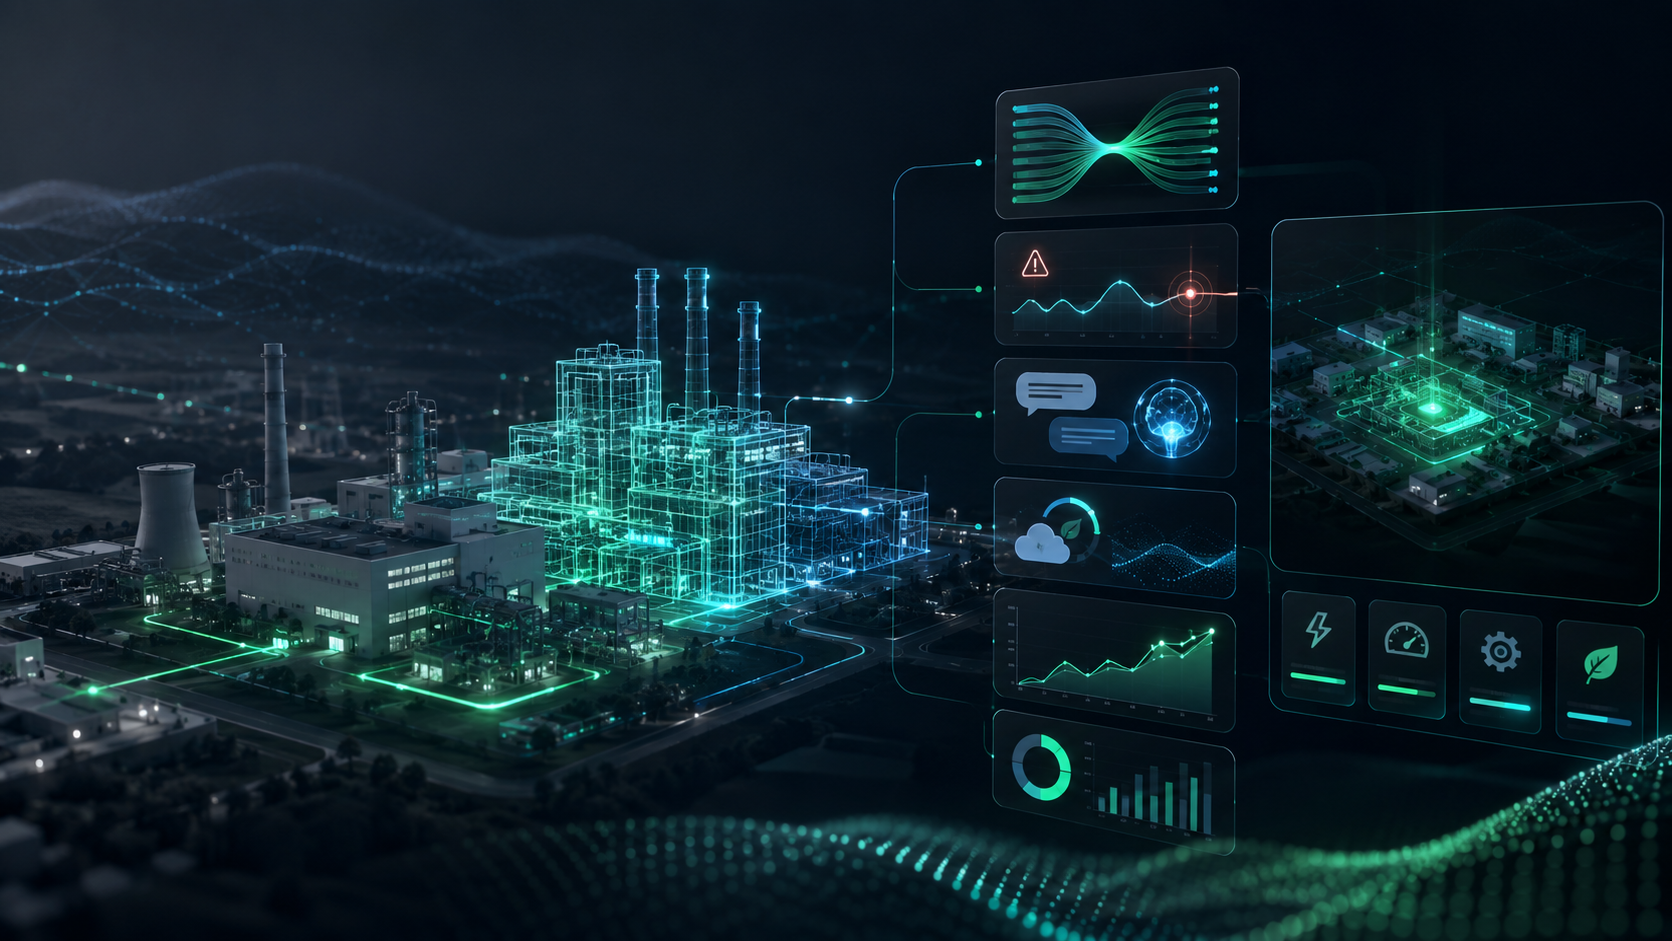
FMCS intelligent operation and maintenance management platform architecture

FMCS server
Intelligent application scenarios
Comprehensive coverage of factory management scenarios
  • Facility Subsystem Management
    Print news
    System real-time display
    Warning alert
    Chart news
    Dashboard
    Warning Report
    Permission management
  • Major events milestone board
    Major event reminders
    Review of major events
  • Operations and maintenance management
    Inspection schedule scheduling
    Maintenance work order tracking
    Emergency response to alarms
    Multi-level notifications for messages
    Maintenance effectiveness evaluation
    Tracing the history of the accident
  • Energy management
    Energy consumption is measured by itemization
    Energy performance assessment
    Demand monitoring
    Regular meter reading
    Energy consumption alert
    Production energy consumption analysis
  • Organizational Carbon Management
    Organize carbon emission accounting
    Organize GHG inventory
    Carbon management
    Carbon reduction
    Carbon emission report
    Data quality evaluation
  • Product carbon management
    Product carbon footprint
    Carbon management
    Carbon emission report
    Data quality evaluation
  • General scenarios
    Facility Knowledge Base
    Equipment Ledger
    Operation records
    Operating Reports
    Multi-platform collaboration
    Work order management
  • Data middle platform
    Integration of multiple data sources
    Document cleaning
    Indicator calculation
    Visualize analysis
Swipe left or right to view more
Communication and protocol layer
Information convergence transmission and exchange
  • IoT cloud intelligent communication gateway
  • Network switch
Edge collection and monitoring
Factory operations subsystem sensing
  • Energy efficiency data center system
    Ice-water system
    Medium and low temperature chilled water systems
    Cooling water system
    Hot water system
  • BA automatic control system
    MAU
    RCU
    PAH
    AHU
    OAC air conditioning box
    DCC system
    General exhaust
  • Intelligent air conditioning
    Air Compression System
    Air compressor cooling water
    Air pressure heat recovery
    Process water systems
  • Meter
    Digital electric meter
    Cold/heat meter
    Digital water meter
    Gas flow meter
    Environmental sensors
  • Third-party system/device integration
    Process exhaust
    Acid and alkali exhaust
    Wastewater system
    FCU module
    Dosing system
    Dust collection system
    Power systems
    FFU
    VOC exhaust
    Pure water system
    Photovoltaic systems
Swipe left or right to view more

Digital device management functions

Monitoring, management, and maintenance comprehensively improve equipment management efficiency
Equipment data collection and configuration
Historical trend analysis
Equipment operation log

Equipment operation and maintenance management

Operations task tracking board
Instantly monitor the status and progress of all operations tasks, with tasks color-coded to clearly distinguish between not started, in progress, completed, or overdue. Quickly filter, query, and view task details, improving management efficiency and response speed.
Operations and maintenance plan board
Provides annual/monthly maintenance schedule and Gantt chart displays, clearly comparing scheduled tasks with actual execution. The system supports automatic reminders and templated scheduling to ensure tasks are executed on time without omissions.
Operation and maintenance operation hour statistics
Automatically counts each person's working hours and task distribution, assisting in analyzing manpower input and work efficiency. Support abnormality alerts and team comparisons serve as a basis for team performance evaluation.
Knowledge base management
Centralized management of various technical documents and handling experience, supporting full-text search and multi-format archives. Facilitate quick review and experience sharing, creating organizational learning assets.

Building a Safe, Compliant, and High-Performance Framework for Smart Operations and Maintenance

Energy and Power Guarantee Group
This ensures absolute reliability and efficiency of the core power supply.
Environment and Process Control Group
Achieve precise control and compliance of the production environment.
Top-level decision-making and management
Transform data into insights to empower management decisions.

A Unified Platform for Site-Wide Visibility and Coordinated Control

Power monitoring systems
Refrigeration station monitoring system
Power and resource management
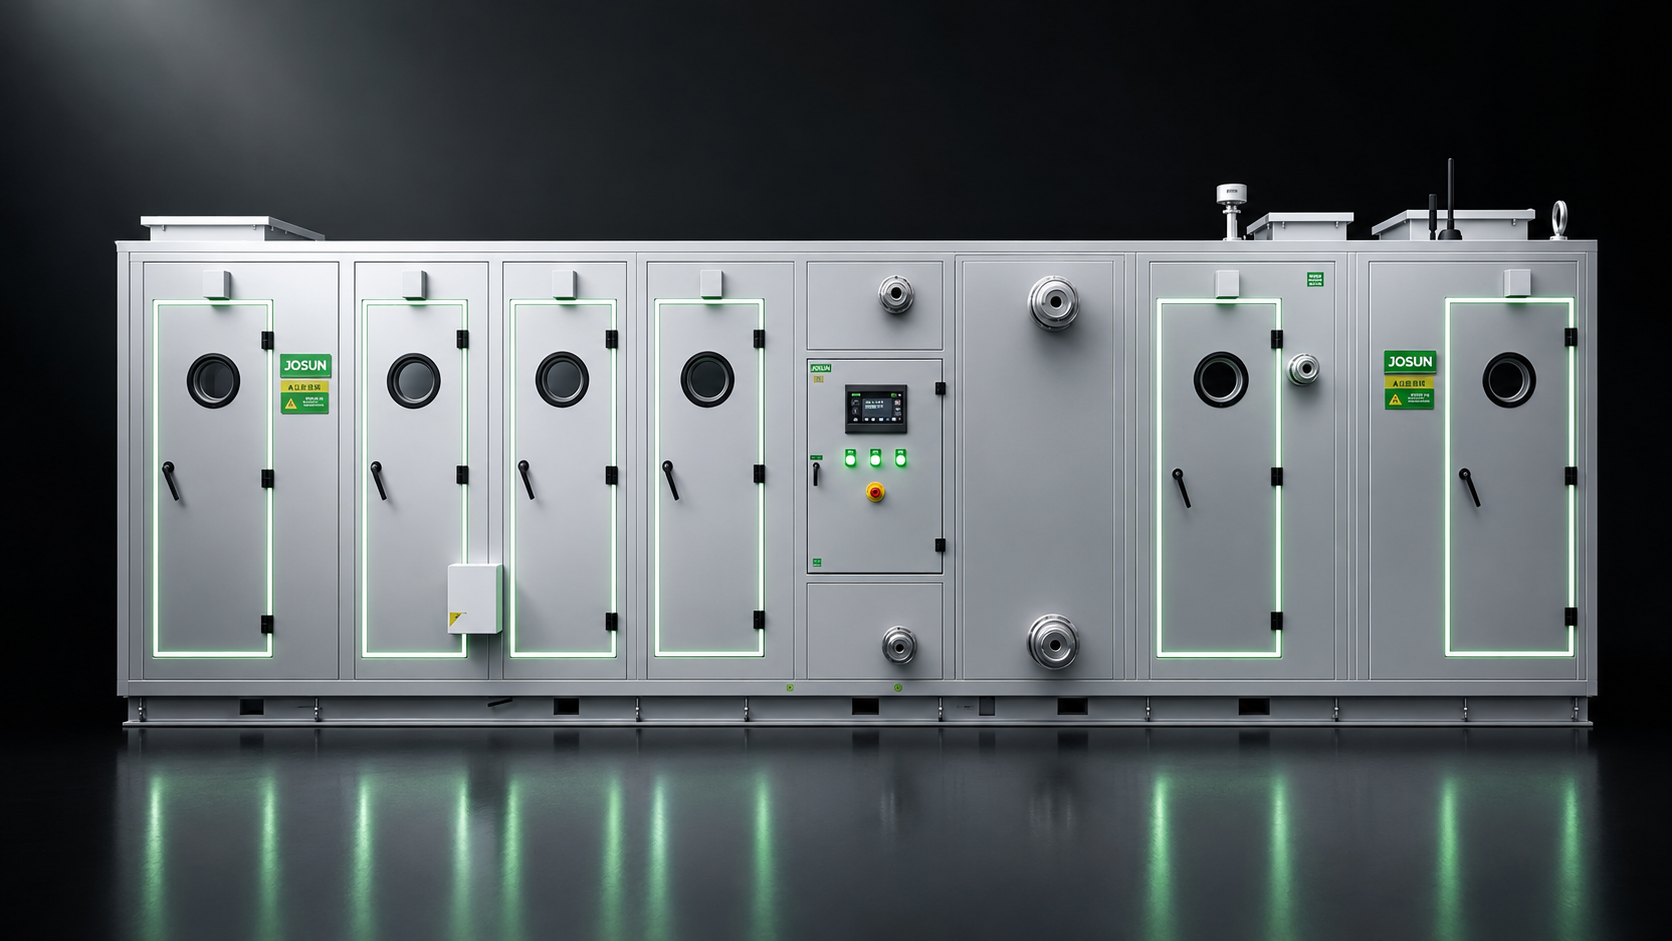
Smart Air Handling Unit (AHU)
Environmental systems
Environmental compliance
Energy management
Operations and maintenance cockpit
Power monitoring systems: the gatekeepers of electrical safety
Design Concept: Focus on "Power Quality" and "Power Supply Reliability".
Monitoring scope
High voltage side: transformer temperature rise, circuit breaker status, comprehensive protection alarm
Low voltage side: U, I, P, Q, PF, harmonic analysis
Core features
Power Topology Diagram: Dynamically displays supply and distribution circuit trajectory and fault location within seconds.
Demand management: Real-time load trends are monitored and alerts for over-planned electricity usage.
Architecture
Communication integration
Refrigeration Station Monitoring System: From Group Control Optimization to Free Cooling
Design Concept: Park Cold Source Hub, Achieving 'High Efficiency (COP)' and 'Unattended Operation'.
Platform features
Energy efficiency cockpit: real-time computing system COP (kW/RT).
Intelligent optimization: Automatically calculates the optimal startup combination and pump frequency conversion.
One-touch start/stop: enables unattended operation and automatic failure switching.
Core strategy
Free Cooling: Automatically monitors outdoor wet-bulb temperatures during transitional seasons, switching to cooling tower mode when conditions are met, utilizing natural cooling sources.
Comprehensive power and resource management
Air Compression/Nitrogen Production Station (CDA&N2)
Core: Focus on 'gas quality' and 'constant pressure.'
Highlights: Analyzes add-offload ratios and calculates unit consumption (kWh/Nm³), avoiding "big horses pulling small cars."
Heating Station (Heating)
Core: Ensuring 'heating stability' and 'system energy efficiency.'
Highlights: Constant temperature/constant pressure closed-loop control ensures stable process heat usage.
Smart Lighting
Core: Achieving "on-demand lighting" and "zoned energy saving."
Highlights: Automatically scheduled according to production shifts, one-click control in the central control room.
Water Systems
Core: Adopt a "data monitoring" strategy for centralized management.
Highlights: Aggregates wastewater/rainwater data, and proactively alerts when key parameters exceed standards or faults.
Smart Air Handling Unit (AHU): Comprehensive solution for integrated MEP control and edge computing
Design Concept: Deeply integrates the physical architecture of the air conditioner enclosure with intelligent algorithms.
Architectural advantages
Integrated intelligent unit: Manufacturer pre-installed controllers and sensors, with built-in optimization algorithms.
Core features
Algorithm-driven: Built-in enthalpy calculation, optimal start-stop, variable static pressure control, and other energy-saving strategies.
Plug and play: only a communication line is needed on-site, greatly simplifying deployment.
Transition season strategy: Automatically increase fresh air utilization, prioritizing natural cooling sources.
Cleanroom environmental monitoring: Provides stable assurance for demanding processes
Design Concept: Focuses on strict control of temperature, humidity, and pressure difference, emphasizing 'local visualization' and 'instant alerts.'
Key indicators
Temperature
Relative humidity
Micro-pressure difference
Platform features
Environmental trend chart: records historical curves for quality traceability and analysis.
Dual alarms: On-site audio-visual alerts + pop-up prompts in the control room, ensuring problems are detected immediately.
Environmental compliance
Process exhaust
Core: Serving as the 'Environmental Compliance Defense Line' and adopting third-party system integration strategies.
Highlights: Automatically generates daily environmental data reports; Map third-party device images 1:1 to FMCS, achieving unified supervision.
Energy Management System (EMS): The actuary of costs
Design Concept: Adhering to the principles of "full energy coverage (breadth)" and "three-level metering system (depth)."
Breadth
Horizontally covering all energy media such as water, electricity, compressed air, and nitrogen.
Depth
Level 1 (Checkpoint): Entire plant
Level 2 (Regional): System/workshop
Level 3 (equipment): High energy consumption equipment
Core output
Energy flow Sankey diagram: Visually displays energy flow direction and loss.
Cost allocation report: Automatically generates energy consumption bills for each department.
Integrated operations and maintenance cockpit: from full-domain sensing to decision support
Design concept: Intelligent brain, providing management with a "one-picture" panoramic view of factory operations.
Operations Command Center
Data refreshes in seconds, providing a "One Page" of real-time panoramic operation.
Summarize green energy efficiency KPIs, supply assurance rates, and environmental compliance rates.
Decision support
Beyond 'surveillance', moving toward 'decision-making.'
Through data mining, proactively identify energy consumption anomalies and potential equipment hazards, assisting in formulating optimization strategies.

Facility Subsystem Management

  • Equipment status monitoring
    Integrate multiple building subsystems, enabling operational analysis of each subsystem through a single interface and real-time monitoring of each system's operational status.
  • Equipment ledger information management
    You can select the appropriate equipment and quickly obtain complete records of its entire lifecycle, including basic information, maintenance information, maintenance information, and repair information, making it easy for operations and maintenance personnel to accurately locate and view information.
  • Device alarm association
    Configurable layout maps of building spaces and equipment. When various faults and alarm information occur, the model can instantly generate corresponding alarms, display precise locations, and pop up the corresponding alarm content.
  • 2D/3D (optional) monitoring interface presentation
    It can integrate BIM models to present 3D architectural visualization interfaces, accelerating the positioning of equipment by operators and maintenance personnel.
  • Equipment energy efficiency analysis
    Analyze equipment energy consumption and operational efficiency to obtain overall operational benefits.

FMCS Supervisory-Level Operations and Maintenance

Exhaust gas system
Comprehensive HVAC monitoring and management
Compressed Air System Monitoring
Pure water system
Dust collection system
Environmental systems
Module control
Power monitoring
Equipped with exhaust system monitoring
Exhaust gas treatment system flowchart (VOC/thermal exhaust/acid-alkali exhaust), fan/damper operation status monitoring, flow direction and airflow of each exhaust gas pipeline, suction hood switch status, and monitoring of exhaust towers (scrubber, combustion, adsorption) operating parameters.
Key operating parameter monitoring
Main fan airflow, duct negative pressure, total system exhaust volume, treatment efficiency of each section, exhaust gas concentration detection (such as VOCs concentration), as well as maximum, minimum, and average statistics of total emissions.
Abnormal alerts and notifications
Alarms for operational faults of exhaust gas treatment equipment (fans, pumps, valves), pipeline blockage/rupture, exhaust gas exceeding limits, and alarm information is instantly pushed to emails and platforms.
Digital twin process monitoring
Visualize equipment layouts, pipeline water flow, and equipment operating, stopped, or fault states.
Critical operating parameter monitoring
Monitor chilled-water and cooling-water supply and return temperatures, chiller condenser entering and leaving water temperatures, pump VFD frequency feedback, and equipment remote/local status.
Anomaly alerts and notifications
Generate alerts when equipment status or operating parameters exceed defined thresholds, with immediate email notifications.
Environmental safety monitoring
Monitor temperature, humidity, and video surveillance feeds.
Digital twin process monitoring
Equipment layout, pipeline pressure and flow detection, equipment operation/shutdown/fault effectiveness
Key operating parameter monitoring
Supply temperature, outlet pressure, outlet flow, specific power......
Abnormal alarms and notifications
Alerts are issued when device status or parameters exceed thresholds, and alert information is promptly sent via email.
Environmental safety monitoring
Temperature and humidity
Digital twin process monitoring
Pure water production system flowchart, raw water/pretreatment/RO/EDI system operation status monitoring, pure water storage tank level monitoring, water supply pump parameter monitoring.
Key operating parameter monitoring
Real-time monitoring of key parameters such as replenishment volume, influent pH value, raw water conductivity, primary and secondary RO pure water conductivity, sand and carbon production tank liquid levels, and primary and secondary RO production tank liquid levels
Abnormal alerts and notifications
Provides early warnings for key items such as water supply pump fault alarms, storage tank high and low liquid level alerts, and pure water quality abnormalities (excessive conductivity), with daily and monthly alarm counts.
Digital twin process monitoring
Visualize the dust collection system process flow and monitor the operating status of main and branch fans, negative pressure and airflow at extraction points and ducts, and dust collectors, including baghouse filters, cartridge filters, and cyclone separators.
Critical operating parameter monitoring
Monitor critical dust collection system parameters in real time, including inlet pressure, differential pressure, unit temperature, inlet temperature, fan frequency, and air velocity.
Anomaly alerts and notifications
Generate alerts for critical parameters, including inlet temperature and pressure, unit differential pressure and temperature, fan frequency and current, outlet temperature, and outlet air velocity. Daily and monthly alert counts are also tracked.
Digital twin process monitoring
Cleanroom and functional area floor plans displayed, with monitoring points for temperature, humidity, pressure difference, and particle count, and real-time overlay of regional environmental data.
Key operating parameter monitoring
Temperature, humidity, pressure difference, cleanliness (particle count) for each zone, supports maximum, minimum, and average statistics, with real-time updates and historical trend analysis.
Abnormal alerts and notifications
Environmental parameter limit alarms (such as abnormal temperature and humidity, reverse pressure difference, particle count exceeding limit), instant email push of abnormal information, and system pop-up reminders.
Module control
Module control
Floor plan control: Monitor equipment status and operate control panels directly from the floor plan.
Schedule control: Import time schedules for automated control.
Digital twin process monitoring
Distribution system topology diagram, switch status monitoring, feed line status, load operating parameter monitoring, transformer/DC panel/comprehensive protection parameter monitoring, etc
Key operating parameter monitoring
Transformer load rate, power factor, maximum, minimum, and average calculation of power data, transformer overheating
Abnormal alerts and notifications
Alerts are issued when device status or parameters exceed thresholds, and alert information is promptly sent via email.

Energy management

The value energy management brings to customers

Identify waste points
System energy consumption rankings, anomaly point prompts identify high energy consumption areas.
Optimize energy efficiency ratios
Analyze the energy consumption trends per unit product by combining capacity data.
Supporting ESG management
System electricity, water, and gas consumption indicators become the foundational data for sustainable management.
IS50001
Energy flow, energy baseline, energy performance

Features of the energy management platform

Energy consumption statistics
Display the company's total consumption of electricity, water, gas, heat, and other energy using unified energy units (such as KGCE).
Demand monitoring
Demand monitoring
Records the enterprise's electricity load and peak usage every 15 minutes, allowing users to view demand in each area of the enterprise.
Time-of-Use Monitoring
Provides electricity usage, consumption, and cost shares for each area by peak, shoulder, and off-peak period.
Energy performance
Energy performance
Evaluates energy performance and utilization across enterprises and facilities, helping managers benchmark efficiency, identify improvement opportunities, and track metrics such as energy use per unit of output, revenue, and floor area.
Instrument status monitoring
Real-time monitoring of the status of edge meters, water meters, and other instruments, as well as the number of devices under different conditions, and recording the time and value of the last upload at key points.

GHG inventory

Feature List - Organizational Carbon Management

Overview of carbon emissions
Organizational Carbon Management
Information management
System settings
Overview of carbon emissions
Core organizational carbon indicators are displayed in a visual chart, filtered by organization and year, and compared with the baseline year.
Organization big screen
Displays the organization's core carbon indicators on a large screen, allowing filtering by year, quarter, or month.
Carbon flow chart
Carbon flow chart
Displays the flow of an organization's carbon greenhouse gas emissions in the form of a carbon flow chart.
Organize reports
Organize reports
Displays the emission status of sources under the organization in report form, allowing data filtering by date, organization, source scope, source type, and other criteria, and viewing daily emission data for individual sources.
Setting organizational boundaries
Manages boundaries between legal entities and organizations, supports data filtering by company name and address, and allows viewing of emissions data under the organization.
Emission source management
Management of emission sources under Scope 1, Scope 2, and Scope 3 supports screening by source type and affiliated organization; Allows basic settings, parameter settings, and formula settings for emission sources, and supports attachment management and daily reporting.
Organize carbon reporting
Generate organizational carbon reports under current legal boundaries by year, providing detailed report viewing and download.
Data center
Data center
View the relevant attachments uploaded to the organizational carbon and provide bulk download functionality.
Full-domain settings
Set global carbon-related presets that can be modified in future standards or policy changes.
Organize a carbon element library
Preset carbon-related variable information for variable invocation when setting emission source formulas, allowing for modification if standards or policies change later.
Equipment management
Synchronize relevant edge devices, allowing viewing basic device information, region, online status, last upload time, and other details.
Unit group management
Organize carbon unit groups and unit information management, set preset units under unit groups, and inter-unit information conversion factors.
Background information source
Organize the management of carbon background data sources
DELIVERY PROCESS

Professionalism and standardization, end-to-end delivery in five major stages

01
Design inspection phase
02
Platform setup phase
03
Project execution phase
04
System Adaptation Stage
05
Operational phase
Design inspection phase

D 0 ESG Preparatory Course
D 1 Sustainability Requirements Definition
D 2 Smart Systems Requirements Definition
D 3 Energy-Efficient MEP Planning and Design
D 4 Green Building Assessment and Design

Platform setup phase

P 0 System architecture analysis
P 1 FMCS Management Platform
P 2 TPMS management platform
P 3 BDCC management platform
P 4 Energy Management Platform
P 5 MEP subsystem intelligent control
P 6 Carbon Emission Management Platform

Project execution phase

E 0 Efficient equipment selection
E 1 Energy-Efficient Chiller Plant
E 2 Smart Air Handling Unit (AHU)
E 3 Smart Lighting Control
E 4 5G smart factory

System Adaptation Stage

S 0 Building Performance Verification Cx
S 1 System equipment performance testing
S 2 HVAC system TAB
S 3 Introduction of system operation and maintenance strategies

Operational phase

O 0 ESG Talent Capability Building
O 1 Carbon Management Capability Training
O 2 Carbon Accounting Rules Training
O 3 Product-Line Carbon Footprint Analysis
O 4 Carbon Peaking and Carbon Neutrality Roadmap
O 5 Supply chain carbon reduction strategies
O 6 IFRS S2 Alignment Preparation
O 7 5-year ESG strategic planning
O 8 Energy consumption and carbon emission data analysis
O 9 Equipment energy-saving improvement assessment
O 10 Introduction of energy management system

APPLICATION

Recommended application scenarios

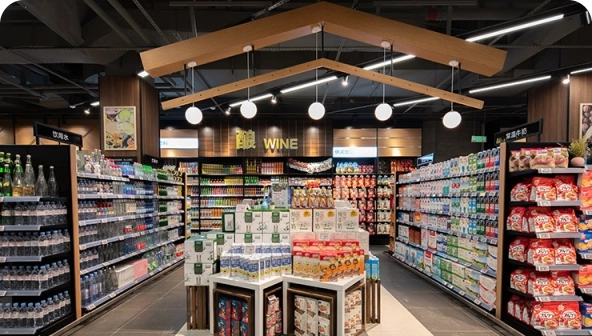
A transportation hub|Commercial complexes|Smart retail
A transportation hub
Commercial complexes
Smart retail
Preferences
You can manage your cookie preferences here. Necessary cookies are used for the basic functions of the website and cannot be disabled. Other types of cookies are only enabled with your consent, and you may modify or withdraw your consent at any time.
Confirm